1. Overall assessment
The 2024 Annual Single Market and Competitiveness Report (ASMCR) of the European Commission was published in mid-February 2024. ERT recognises the value of such an exercise and invites the Commission to further fine-tune this practice. Given that ERT has dedicated several publications to removing Single Market obstacles and using KPIs to benchmark competitiveness (see Chapter 5), it recommends the continued use of a data-driven focus for developing and implementing adequate policies at EU-level.
The nine competitiveness ‘drivers’ and related KPIs in the ASMCR were identified by the Commission in its Communication on Long-term Competitiveness (March 2023) and are a welcome development, as they help to track and quantitatively measure progress on certain KPIs. However, the macro-economic data in the ASMCR provide only a (partial) snapshot of the state of European competitiveness.
Overall, the ASMCR does not convey the sense of urgency and alarm that the EU’s industry and wider business community have been raising about Europe’s declining competitiveness. This is surprising given that, for instance, the latest Eurostat figures from March 2024 showcase that industrial production in the EU is down significantly, by 5.7%, in comparison to January 2023.
Importantly, the ASMCR and its accompanying documents do not:
Sufficiently compare the state of Europe’s competitiveness and the costs of doing business within the EU with our global competitors as there is little to no benchmarking focussing on critical metrics such as private investment (e.g. FDI), the cost of doing business, green tech solutions or innovative digital tech (AI).
Contain a list of obstacles experienced by businesses in the EU Single Market and no in-depth assessment of the current regulatory burden is provided (e.g. administrative burden and reporting requirements). The Commission actually used to publish annual competitiveness reports, which were much more granular, and compared the competitive situation between various EU Member States, before this practice was discontinued in 2014.
Contain a list of companies’ closures and/or data on companies scaling down business operations in the EU and/or examples of companies’ investment decisions that prioritise other regions instead of the EU. Such examples could help in making the entire discussion on competitiveness more tangible and relatable.
Set out detailed recommendations and a suggested roadmap for actions to tackle Single Market barriers and bringing down the regulatory burden on companies.
Furthermore, the KPIs used to measure progress on the nine drivers do not go far enough – either the overall analysis is incomplete or the KPIs are not exhaustive and too selective. To give an example of skewed results, KPI 3 in the ASMCR (see Figure 1) analyses only private investment in the EU as a share of GDP, suggesting the EU is ahead of the UK and US. However, this metric does not mean that Europe is more competitive or has a relatively more attractive business environment. What is the usefulness of plotting the FDI in the EU against the growth in the EU, especially given the fact that growth has been sluggish in the past 5-10 years?
Instead, the European Commission should measure:
The FDI inflows in the EU compared to global FDI flows (Figure 2). When comparing Europe’s FDI inflows over time, one sees it going down gradually since 2017. The year 2022 even witnessed negative FDI inflows to Europe, which means that private investors divested more FDI from Europe than they invested in Europe. Meanwhile, since 2017, FDI inflows in the USA and China have gone up.
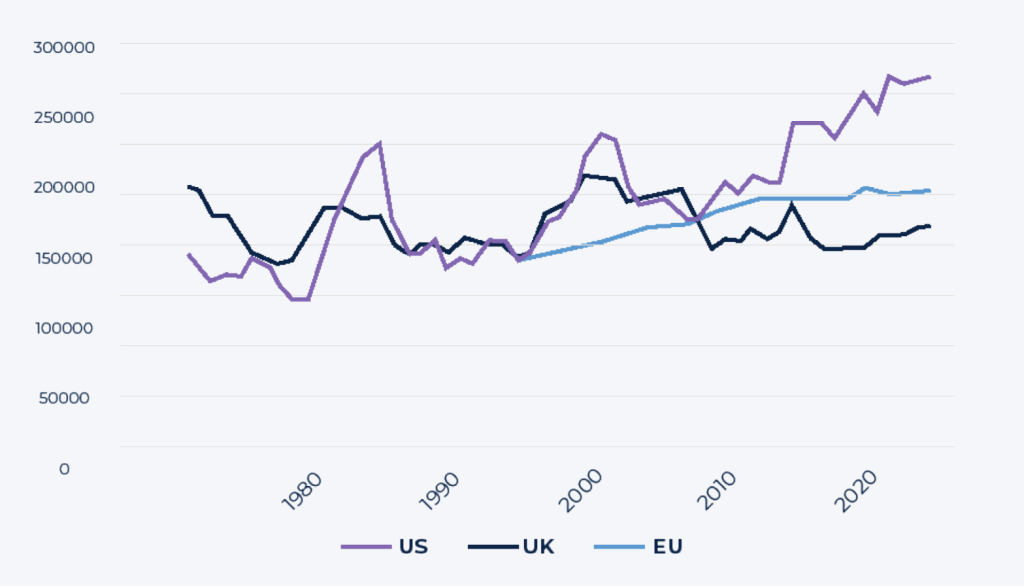
The divergence in real capital stock per person employed between Europe and the US since 2007/2008, as it reflects the growing productivity growth gap between these two economies (Figure 3).
These two metrics would help provide a more impartial and objective view on Europe’s economic situation. Ultimately, such conventional indicators underline Europe’s underperformance and sliding competitiveness in international comparison.
Finally, the recommendations in chapter 4 of this appraisal set out how the analysis of competitiveness and the Single Market can be made more “fit for purpose”, such as by:
making it more focused on cross-border obstacles as reported by businesses and other stakeholders;
identifying which Member State / Commission entities should be responsible for tackling specific obstacles;
tracking progress on removing obstacles (with a detailed annex, along the lines of the policy tracker in the Commission Staff Working Document accompanying the ASMCR, or a more detailed spreadsheet).
Fig. 1. Private investments as share of GDP.
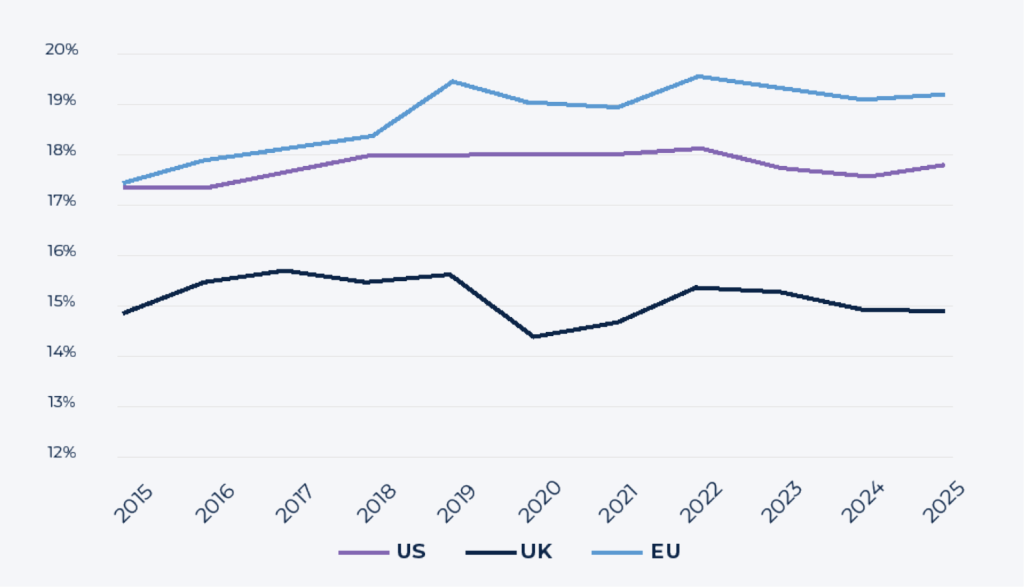
Fig. 2. Europe’s FDI inflow was negative in 2022.
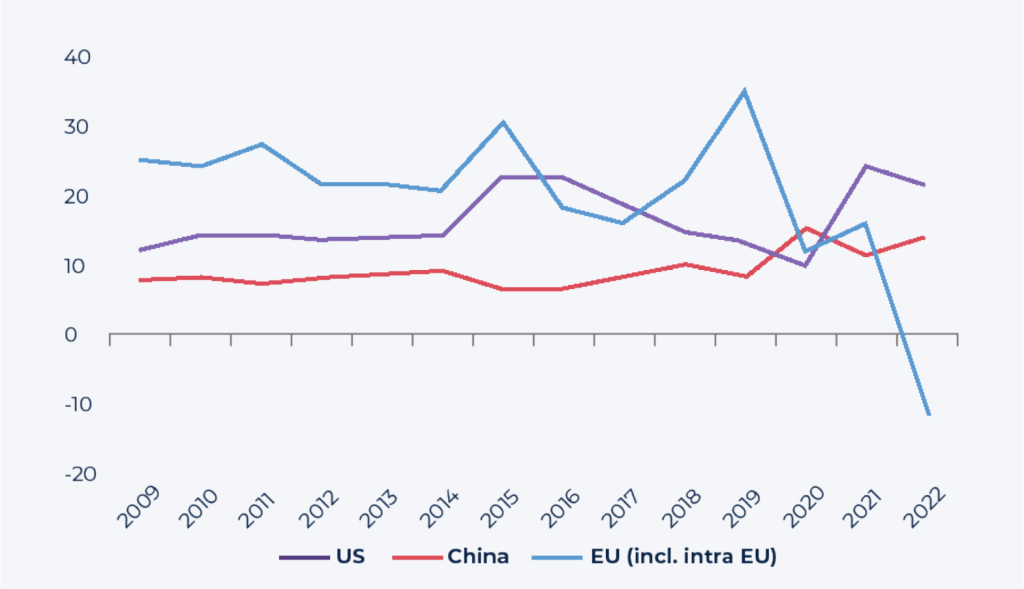
Fig. 3. Europe’s stagnating productivity growth.
Download at the link below to read the full article.