Think you know just how competitive Europe is?
Take the 12 question quiz and find out.
Start

HLI 1
Global industry market share of gross value-added
Whose industry has the highest gross value-added?

China

EU

US
Back
Continue
Global industry market share
% of global gross value added (GVA) in mining, manufacturing and utilities
% of global gross value added (GVA) in mining, manufacturing and utilities
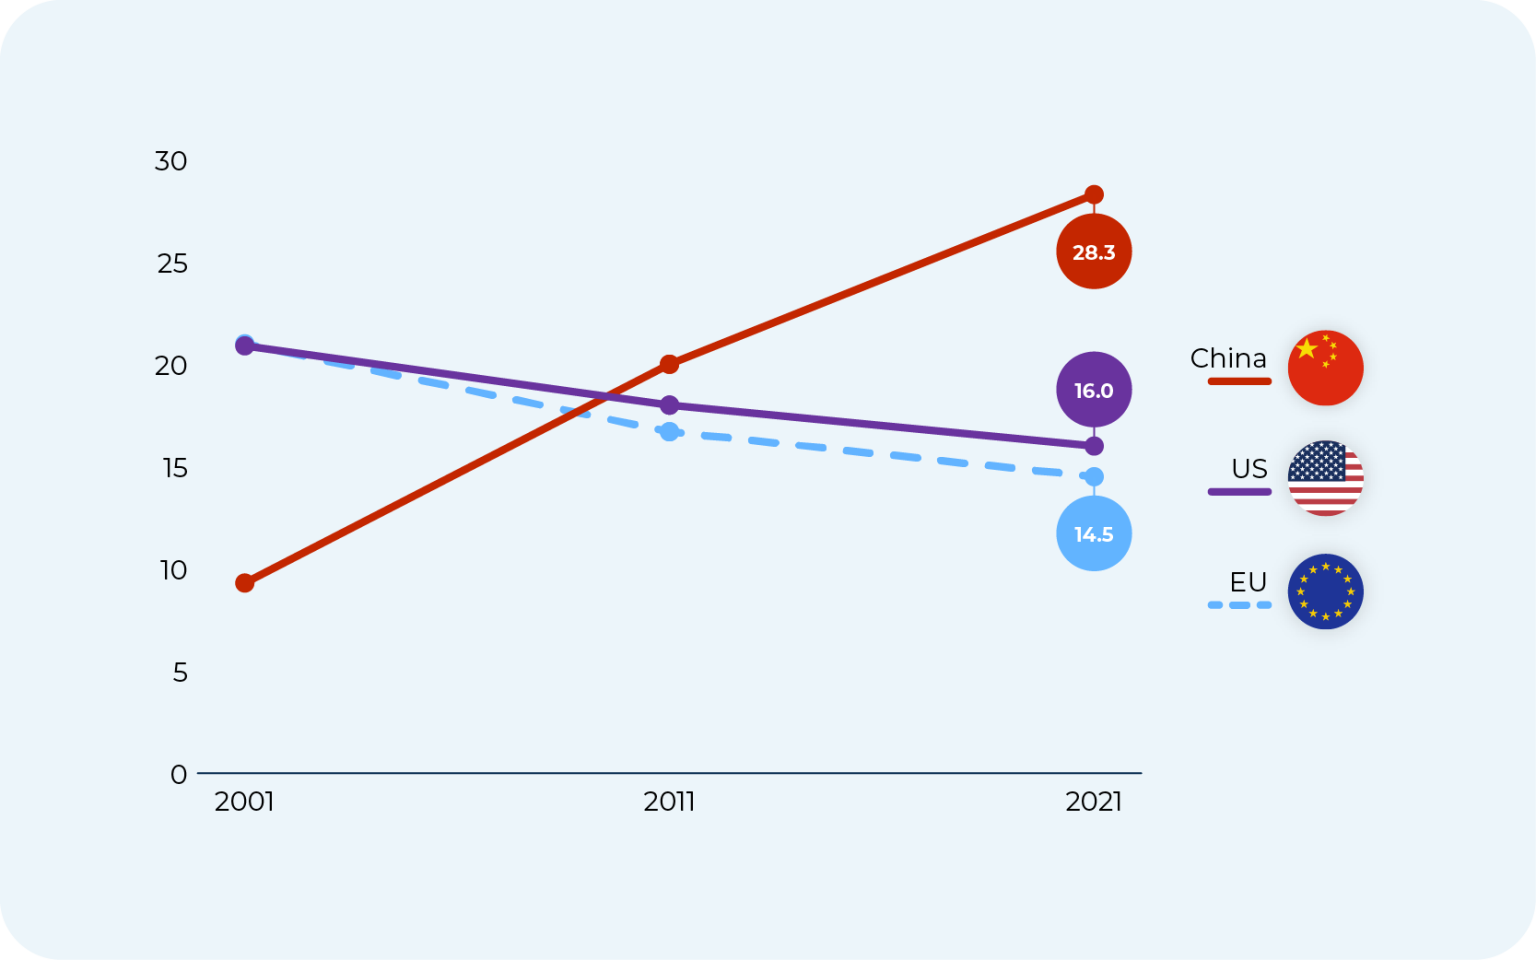
China has the lead on this. Over the past two decades, the EU's share of global markets has been declining.
Back
Continue

HLI 4
Share of companies in the FORTUNE Global 500
Who has lost the most ground in the past 20 years?
China
EU
US
Back
Continue
Share of companies in Fortune Global 500 by revenue
%
%
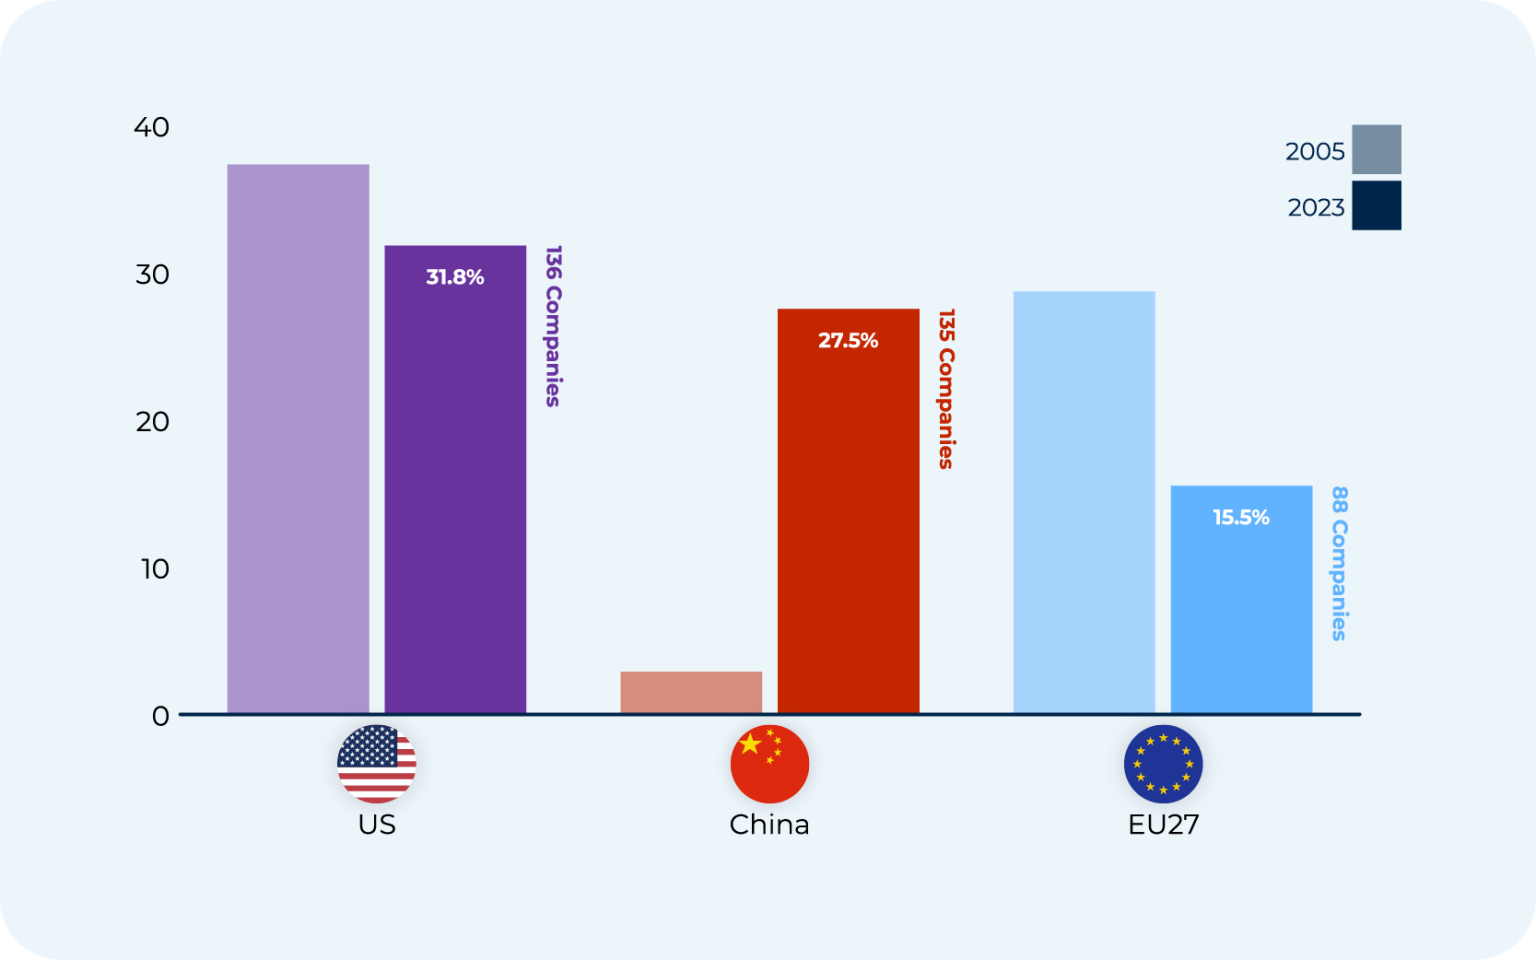
As you can see, the EU's share has halved.
Back
Continue

KPI 11
Exports of high technology manufactured goods
Rank the following
1st
Please Select
↓

ASEAN
China
EU

Japan
US
2nd
Please Select
↓
ASEAN
China
EU
Japan
US
3rd
Please Select
↓
ASEAN
China
EU
Japan
US
4th
Please Select
↓
ASEAN
China
EU
Japan
US
5th
Please Select
↓
ASEAN
China
EU
Japan
US
Back
Continue
Medium and high technology manufacturing gross value added Global market share
%
%
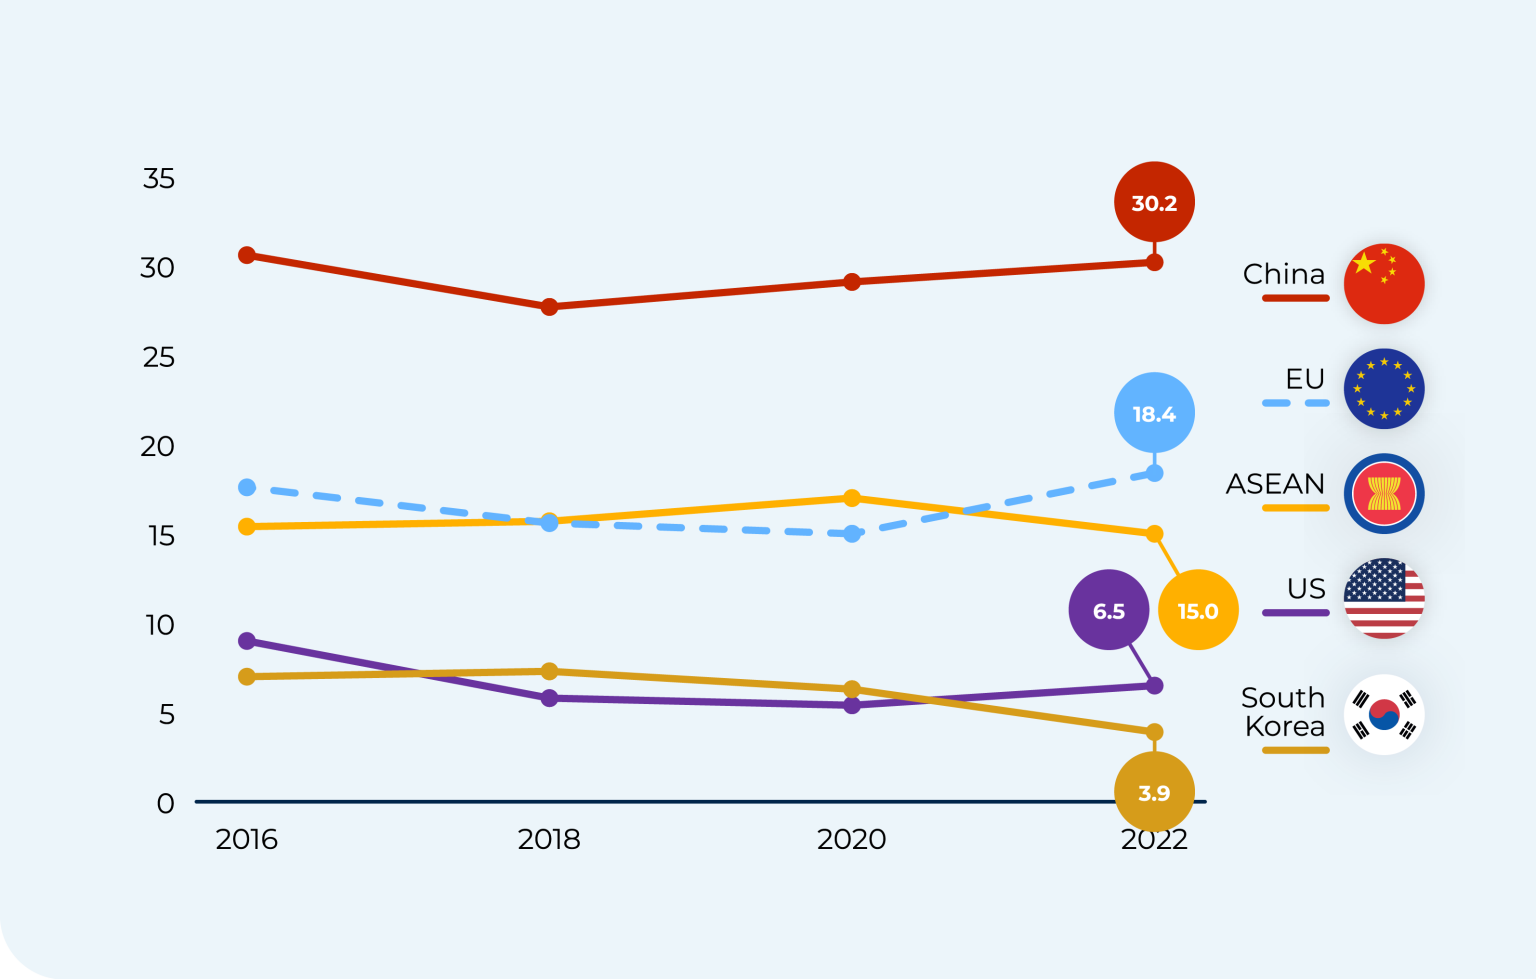
China is in the lead, but the EU remains a competitive exporter of high technology goods.
Back
Continue

KPI 5
Greenfield FDI inflows
Rank the following
1st
Please Select
↓
China
EU
US
2nd
Please Select
↓
China
EU
US
3rd
Please Select
↓
China
EU
US
Back
Continue
Greenfield FDI inflows Value of announced greenfield FDI
USB bn
USB bn
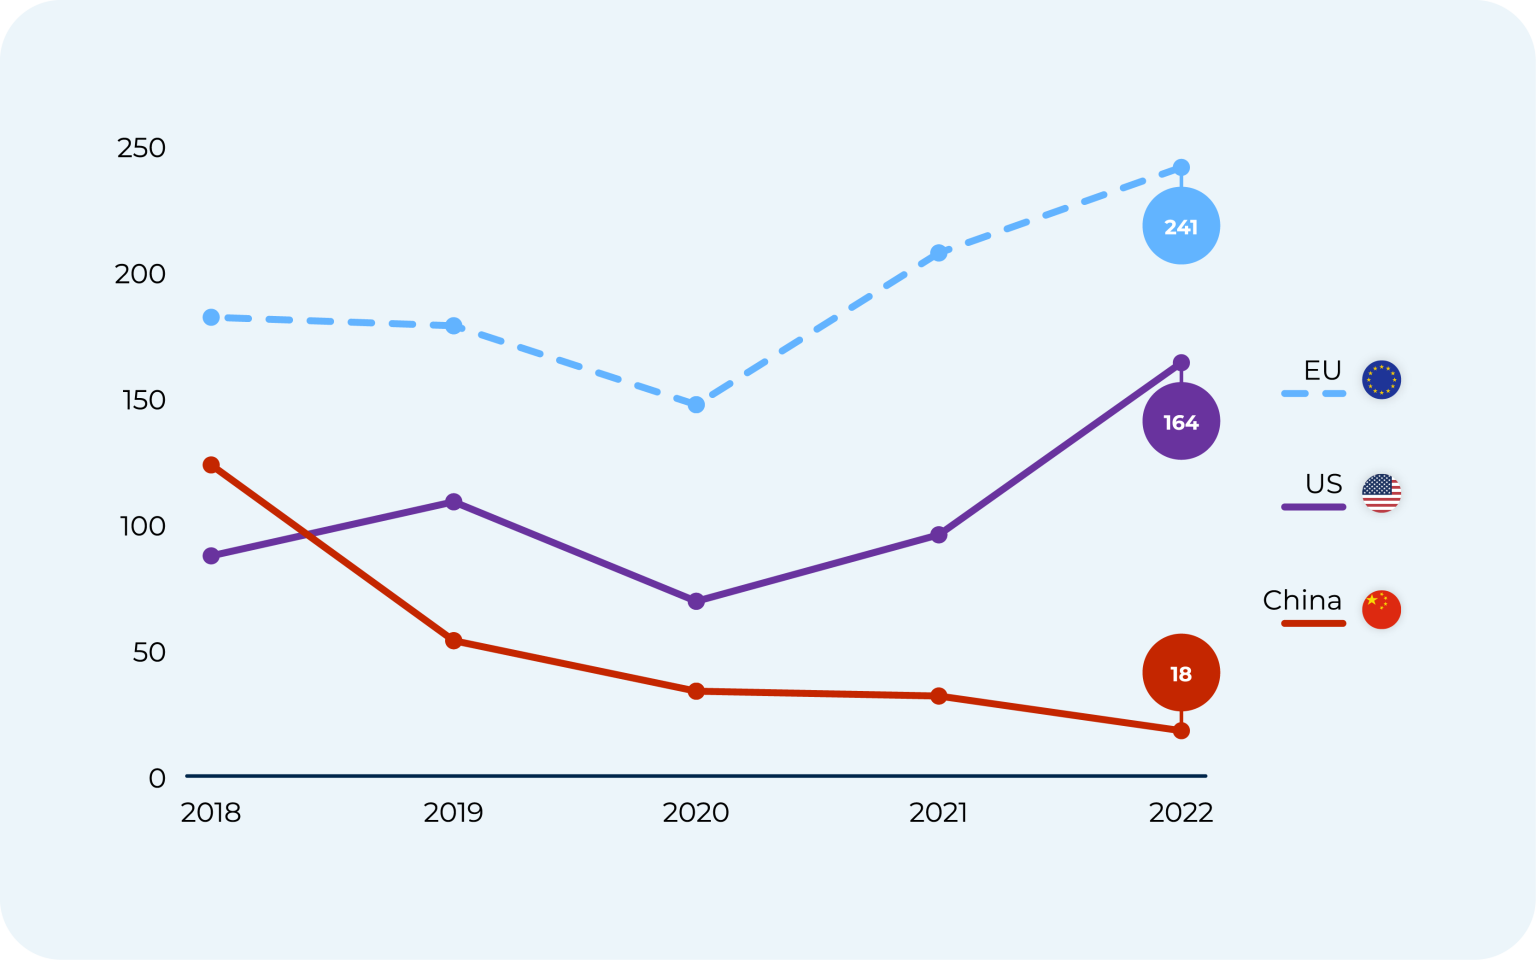
In the last decade, the EU has been the lead destination for greenfield investment, but the US Inflation Reduction Act may well change this ranking soon.
Back
Continue
KPI 3
Intra EU goods & services trade
How well-developed is Europe’s Single Market?
Back
Continue
Intra-EU trade in goods and services
% of GDP
% of GDP
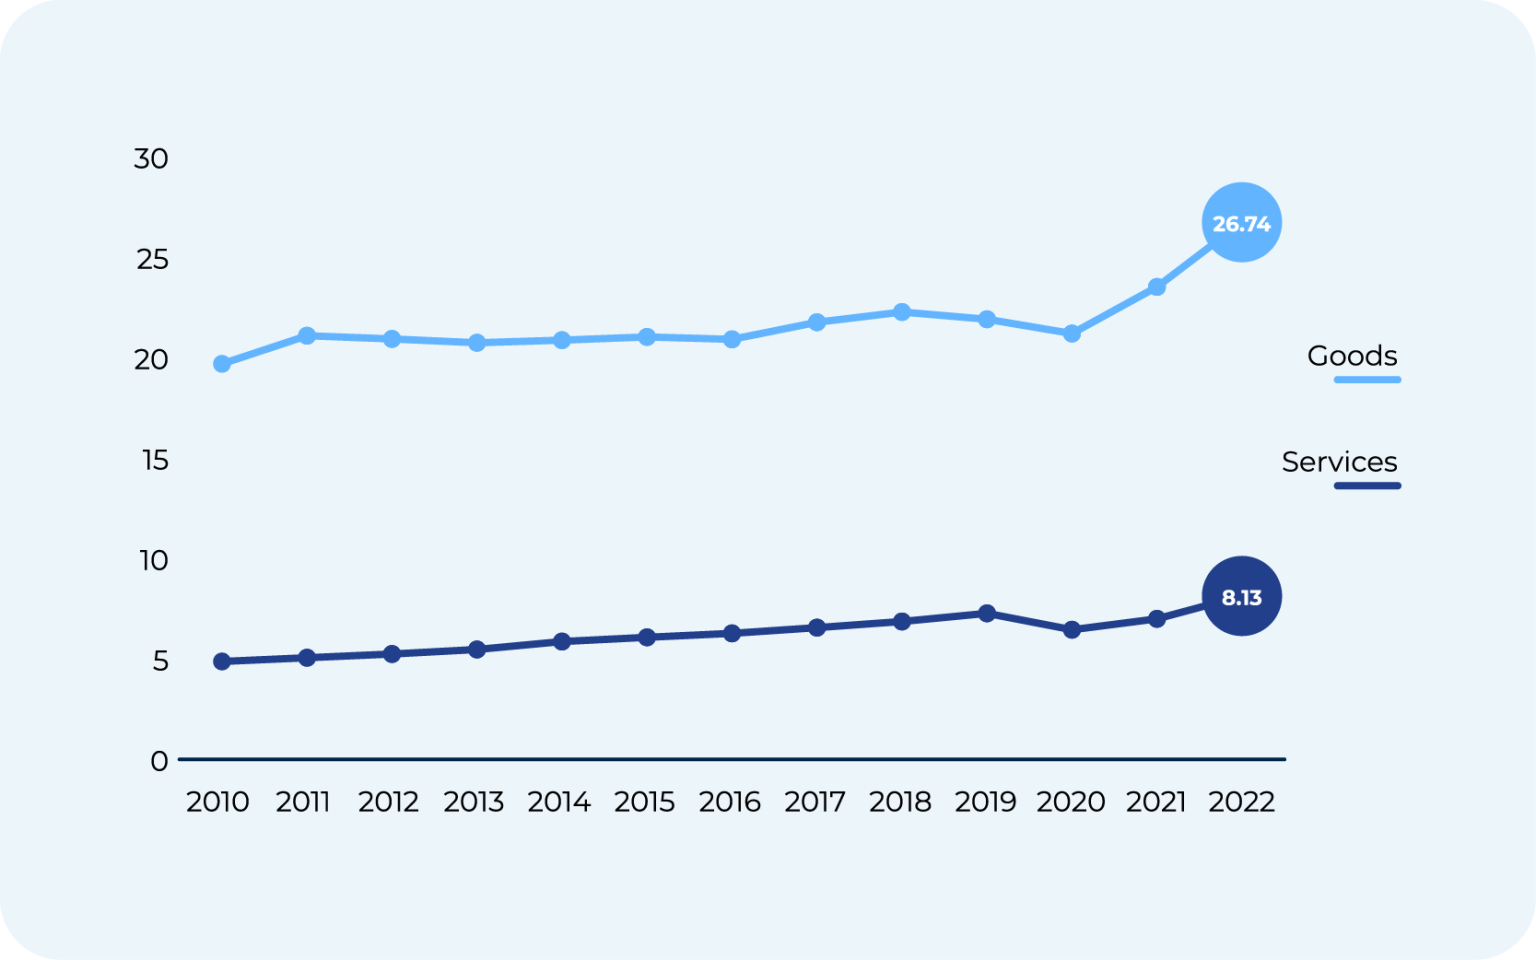
Intra-EU trade still has a lot of room to grow, not least in intra-EU trade in services. Compelling evidence that the EU Single Market needs further integration.
Back
Continue

KPI 11
R&D intensity (R&D spending as a share of GDP)
Pick the top 3
1st
Please Select
↓

Israel

South Korea
US
2nd
Please Select
↓
Israel
South Korea
US
3rd
Please Select
↓
Israel
South Korea
US
Back
Continue
Total R&D spending as a share of GDP
%
%
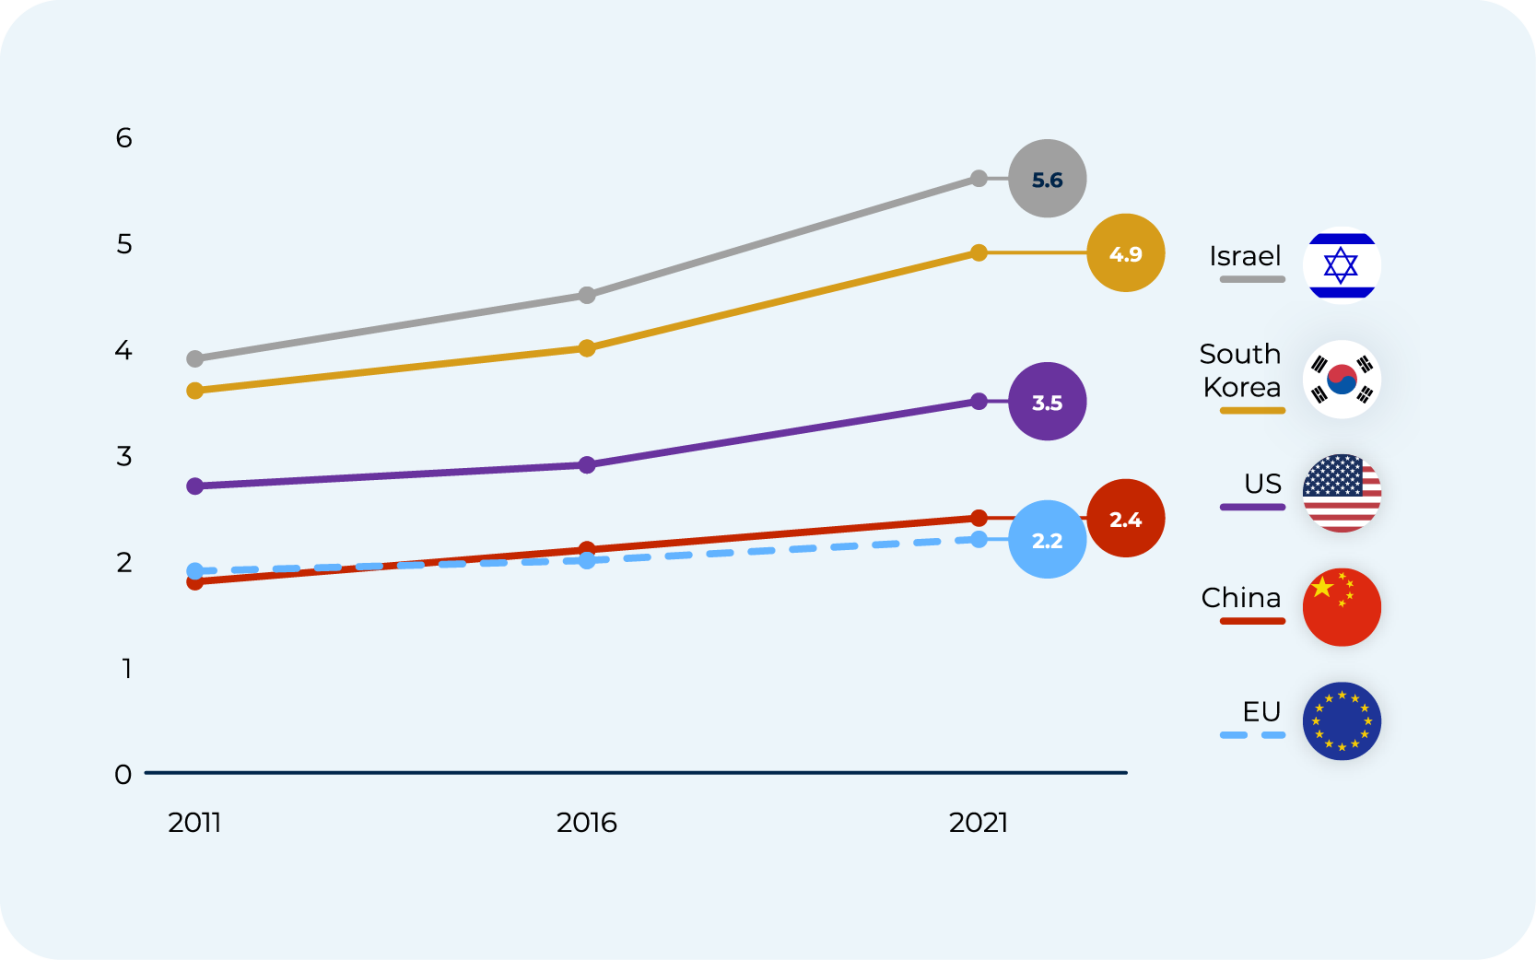
As the engine of innovation - and future competitiveness - the EU urgently needs to increase R&D expenditure.
Back
Continue

KPI 17
Government budget allocation for defence R&D
Rank the spenders
1st
Please Select
↓
South Korea
EU-27

UK
US
2nd
Please Select
↓
South Korea
EU-27
UK
US
3rd
Please Select
↓
South Korea
EU-27
UK
US
4th
Please Select
↓
South Korea
EU-27
UK
US
Back
Continue
Government budget allocation for defence R&D 2022
% of GDP
% of GDP
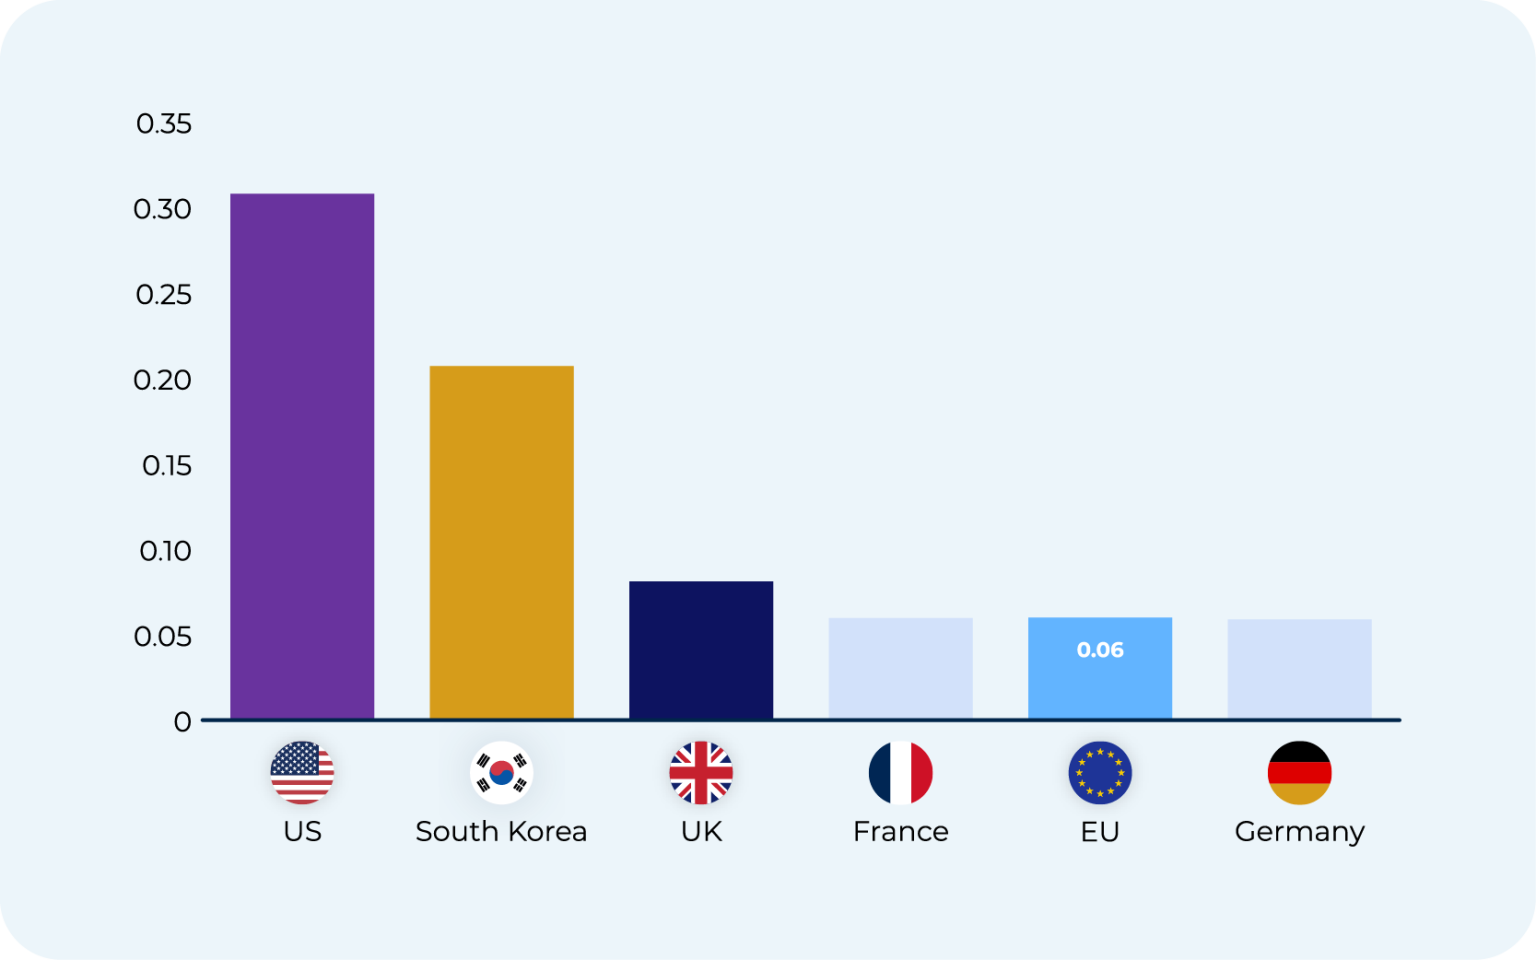
In this new era in which security has returned to the fore, the EU has to move up a gear in its approach to defence R&D.
Back
Continue

KPI 21
AI talent concentration
Who has the highest concentration of AI talent?
EU

India
Japan
South Korea
US
Back
Continue
AI talent concentration by country
%
%
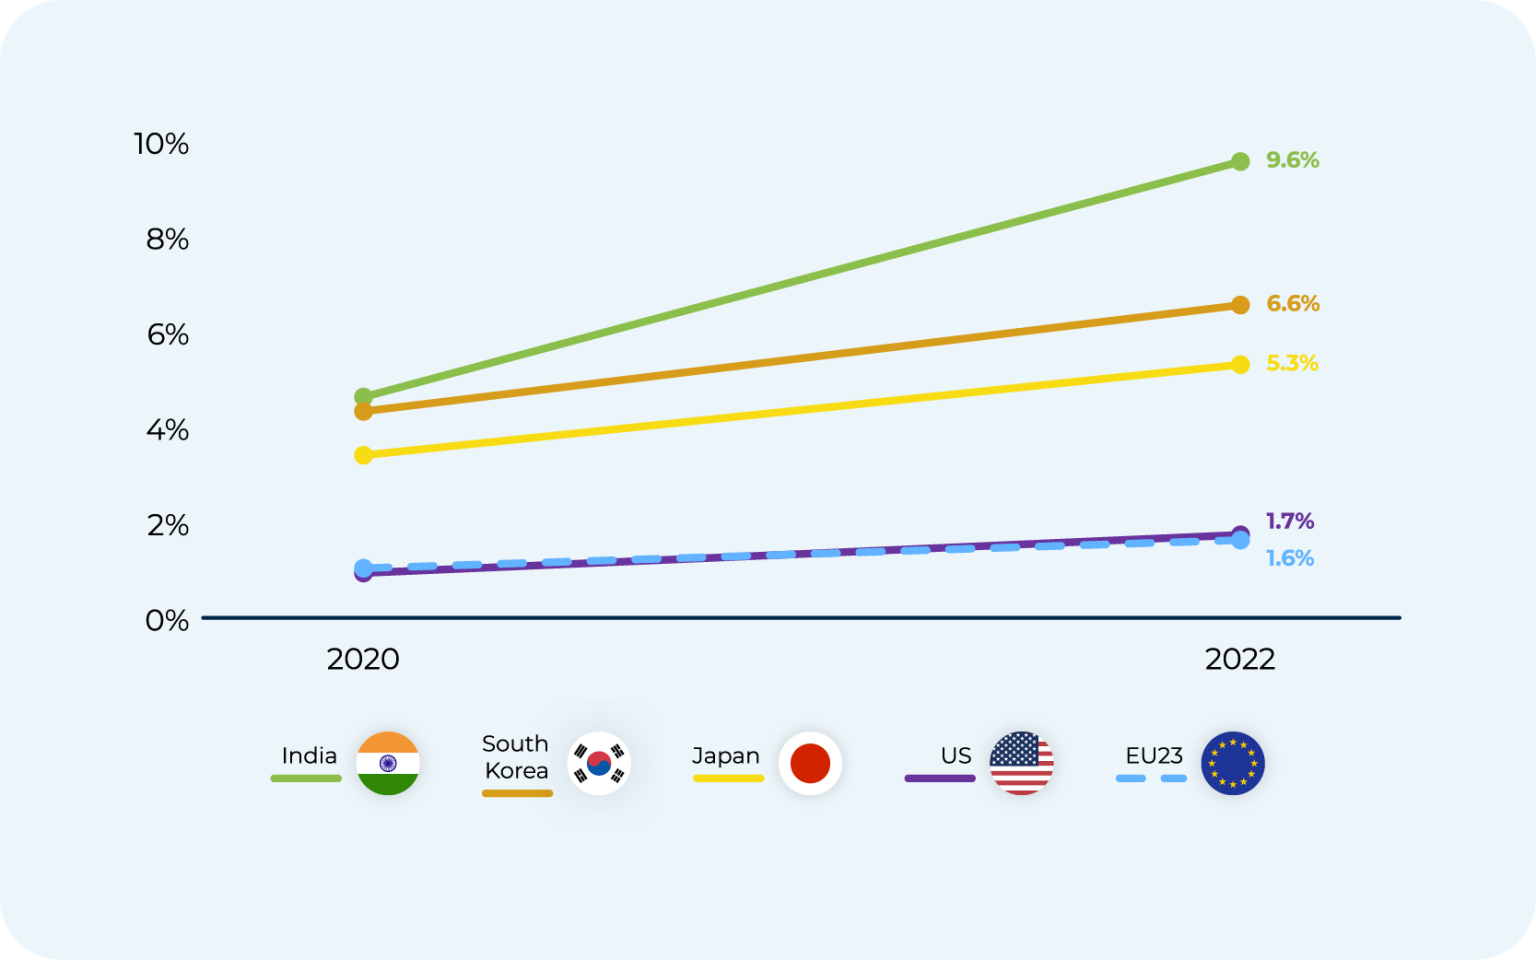
India. AI is the most significant new tool in the world right now and Europeans will have to quickly become proficient users.
Back
Continue

KPI 24
Fibre connections fixed broadband
Where does fibre make up the highest share of fixed broadband connections?
EU
Japan
South Korea
US
Back
Continue
Fibre connection in total fixed broadband
%
%
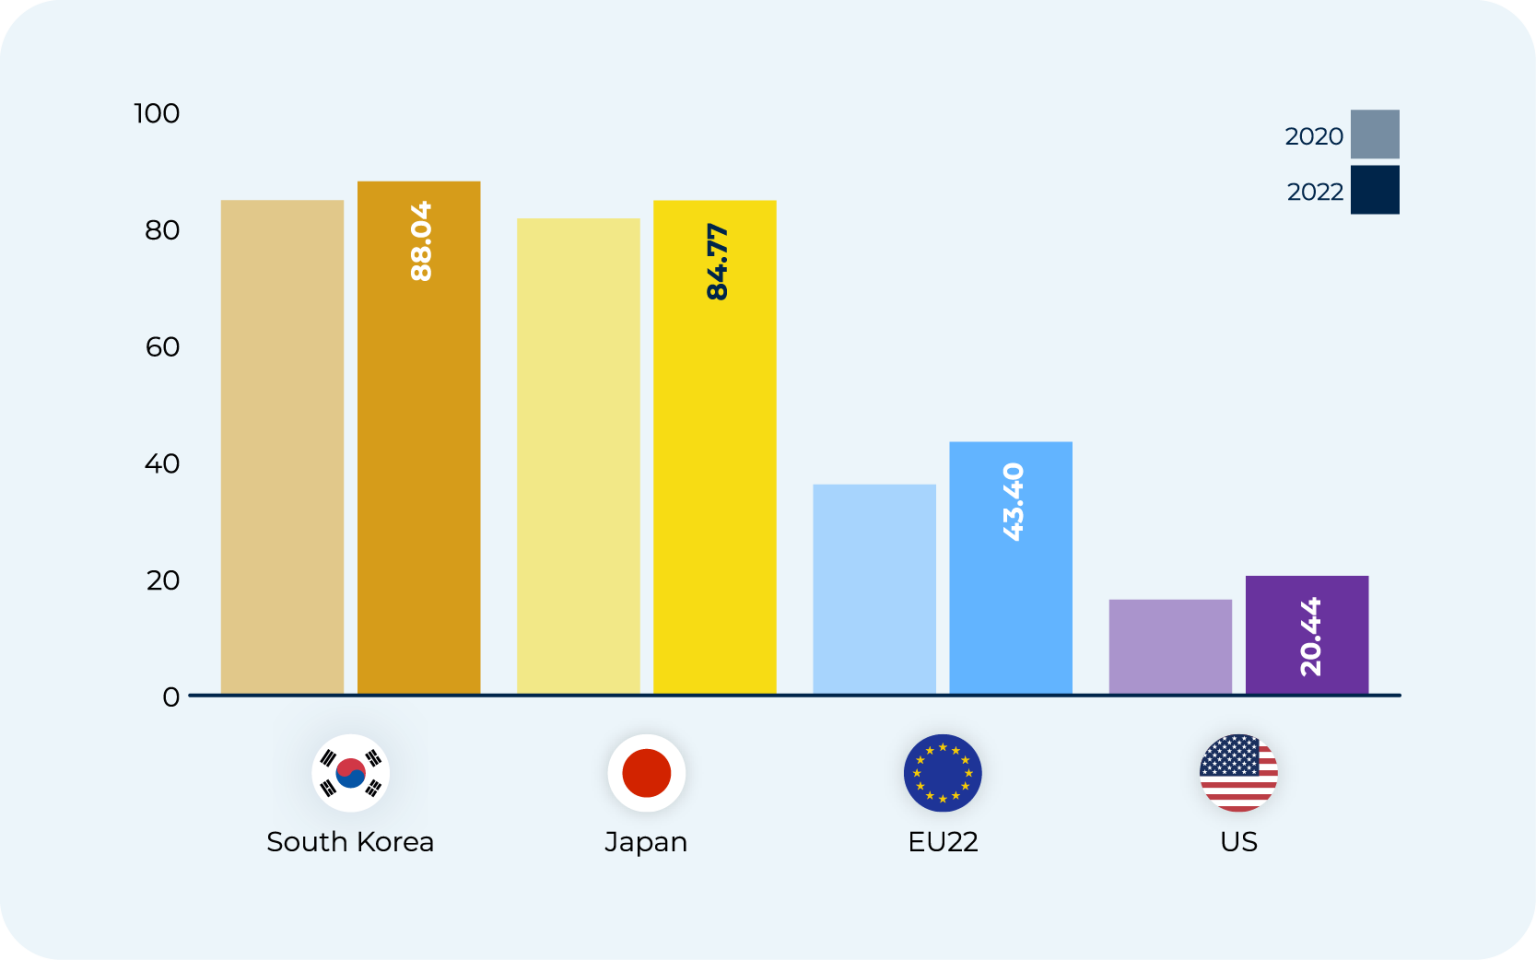
Fixed broadband - a significant enabler of digital transformation - is another area where the EU needs to advance.
Back
Continue

KPI 23
5G mid-band coverage
Whose 5G mid-band coverage has been expanding fastest in the last 2 years?
China
EU & UK
South Korea

UAE
US
Back
Continue
5G mid-band population coverage
%
%
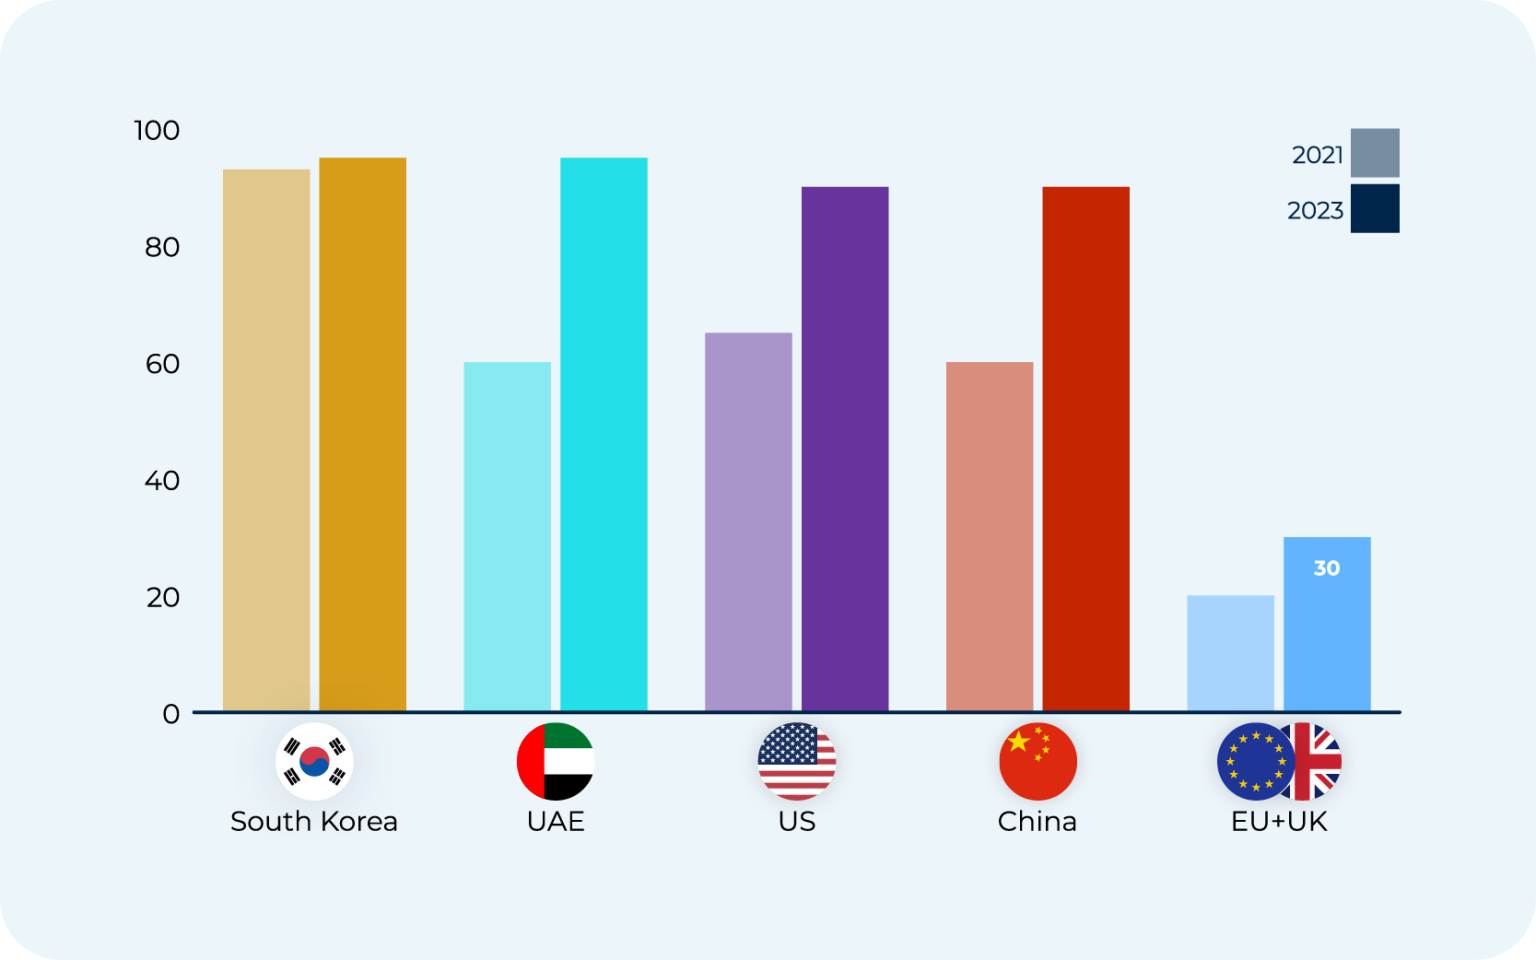
South Korea is leading in 5G mid-band rollout and the UAE is catching up very fast. Deployment in Europe lags far behind.
Back
Continue
KPI 35
Electricity network investment
Rank the biggest spenders
1st
Please Select
↓
China
Europe
US
2nd
Please Select
↓
China
Europe
US
3rd
Please Select
↓
China
Europe
US
Back
Continue
Electricity network investment
Investment spending in USD bn, 2022
Investment spending in USD bn, 2022
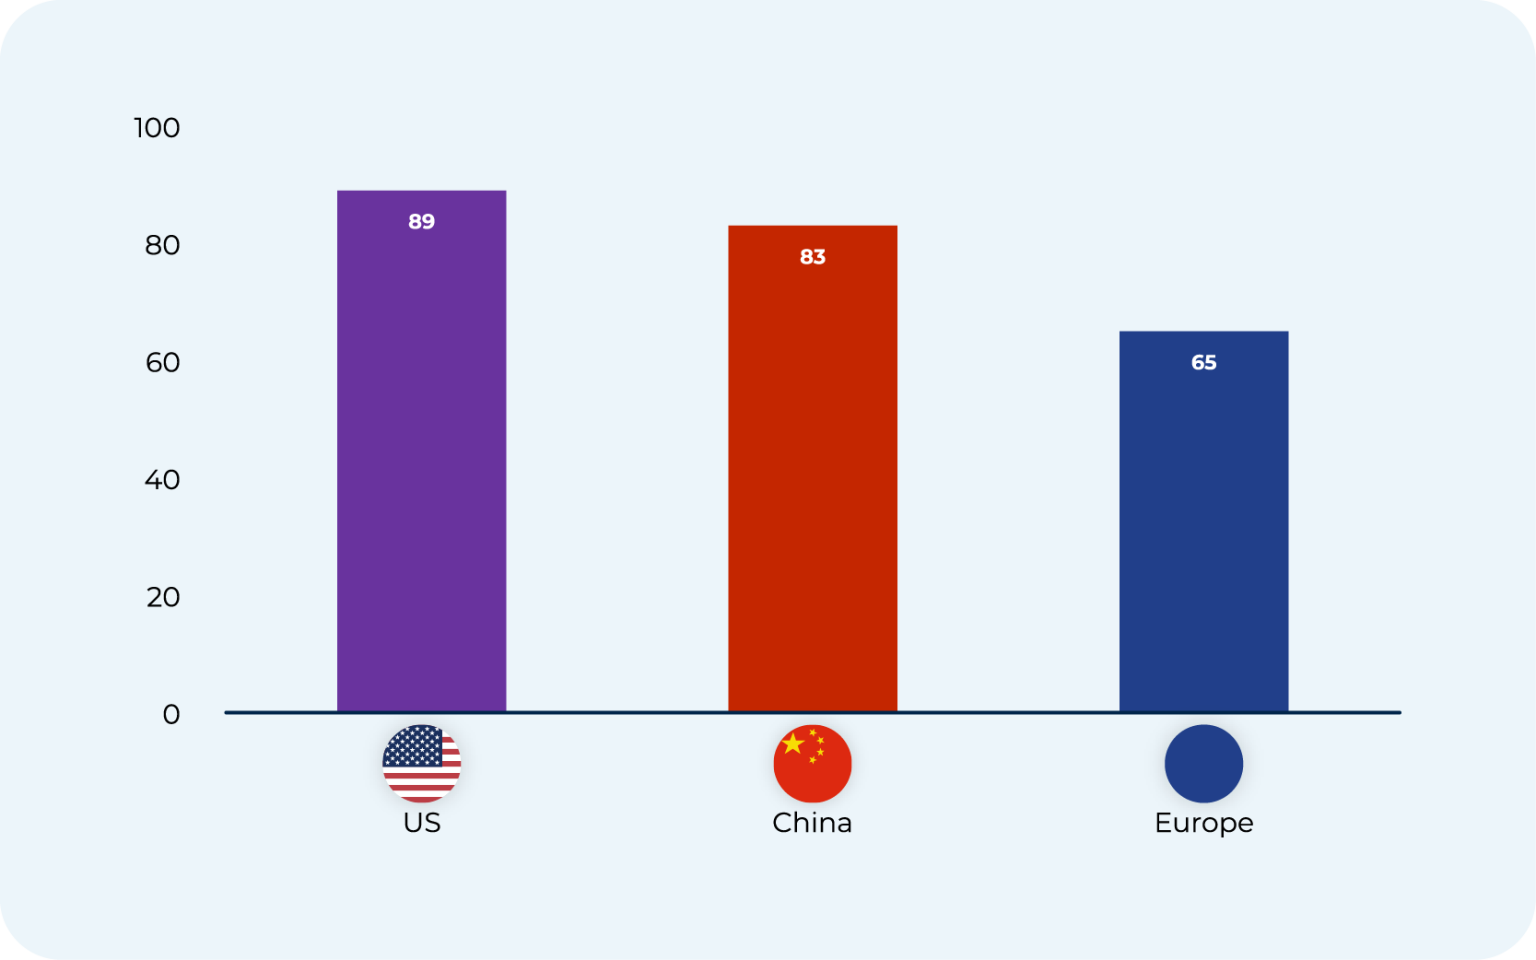
The US leads in this, with China not far behind. Europe needs to spend on more and better electricity grids.
Back
Continue
KPI 36
Hydrogen use by regions
Back
Continue
Hydrogen use by region
% of total hydrogen usage
% of total hydrogen usage
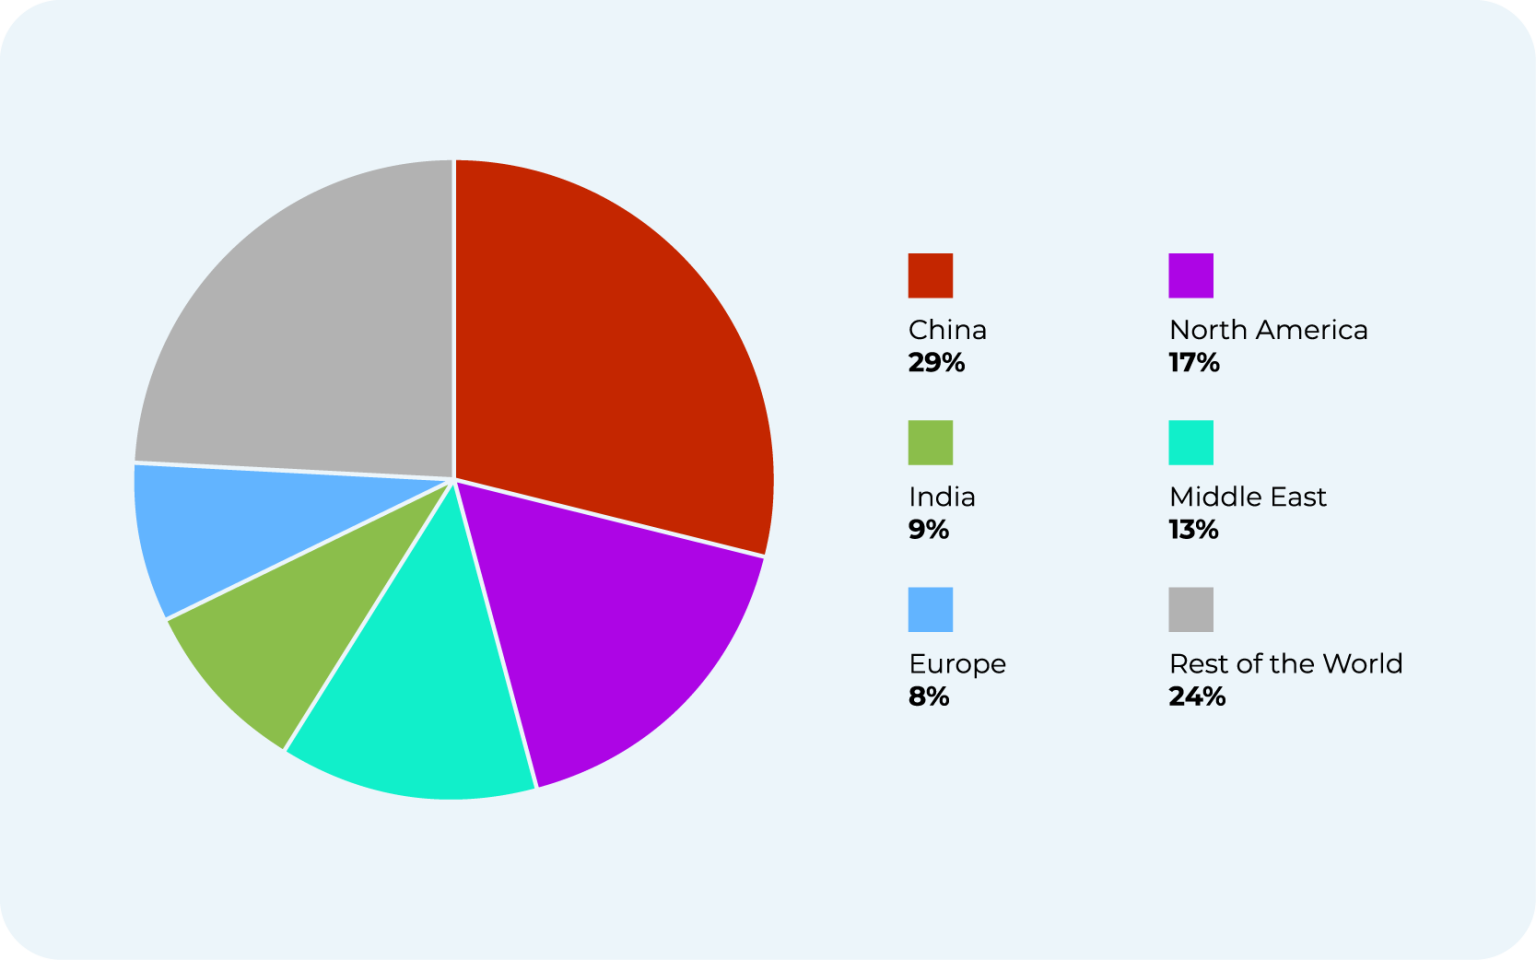
While investment in hydrogen production is increasing in Europe, more incentives are needed to scale-up investment and innovation in this area.
Back
Continue
Thank you taking our Competitiveness Quiz.
Surprised by the answers?
Check out the set of insights in ERT’s 2024 Competitiveness and Industry Benchmarking Report.